Graphical Models
A graphical model is useful to visualize how the BEAST is structured and works. See Gordon et al. (2016, ApJ, 826, 104, <http://adsabs.harvard.edu/abs/2016ApJ…826..104G>) for more details on the BEAST.
Text version
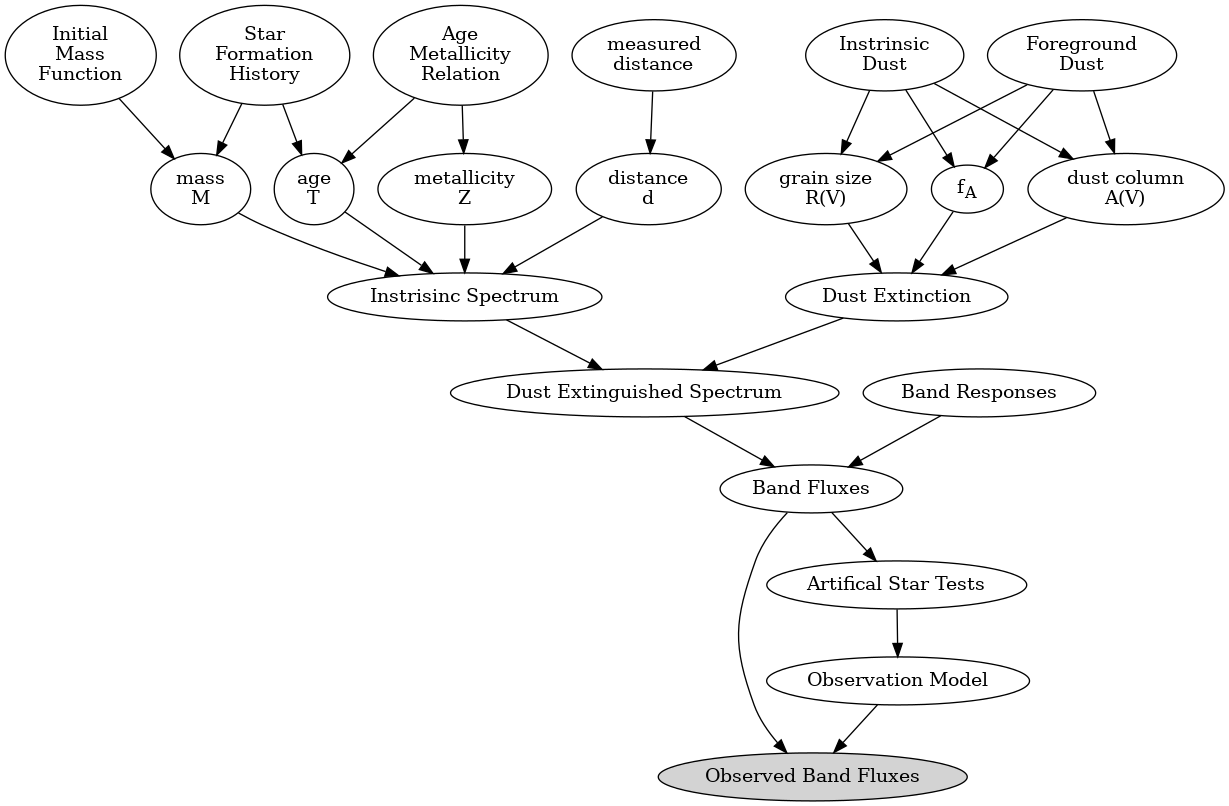
Generated with the beast plot_graphic_model --type=text --savefig=png.
Math version
Based on equations in Gordon et al. (2016).
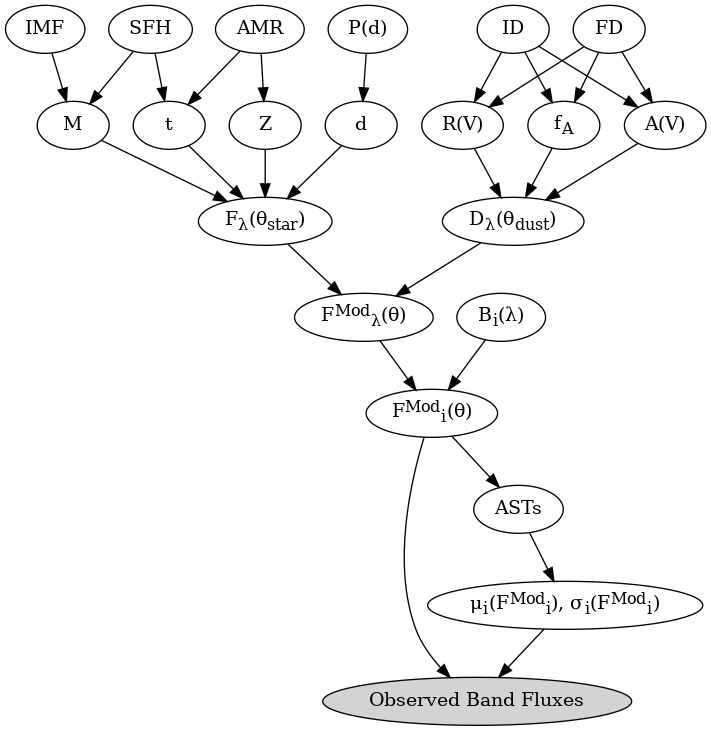
Generated with the beast plot_graphic_model --type=math --savefig=png.
Graphical Model of Output Files
This visualizes how BEAST runs create files when using either (a) subgrids or (b) source density (SD) splitting. To visualize the use of both, replace each SED subgrid branch with an instance of the SD file tree.
Subgrids
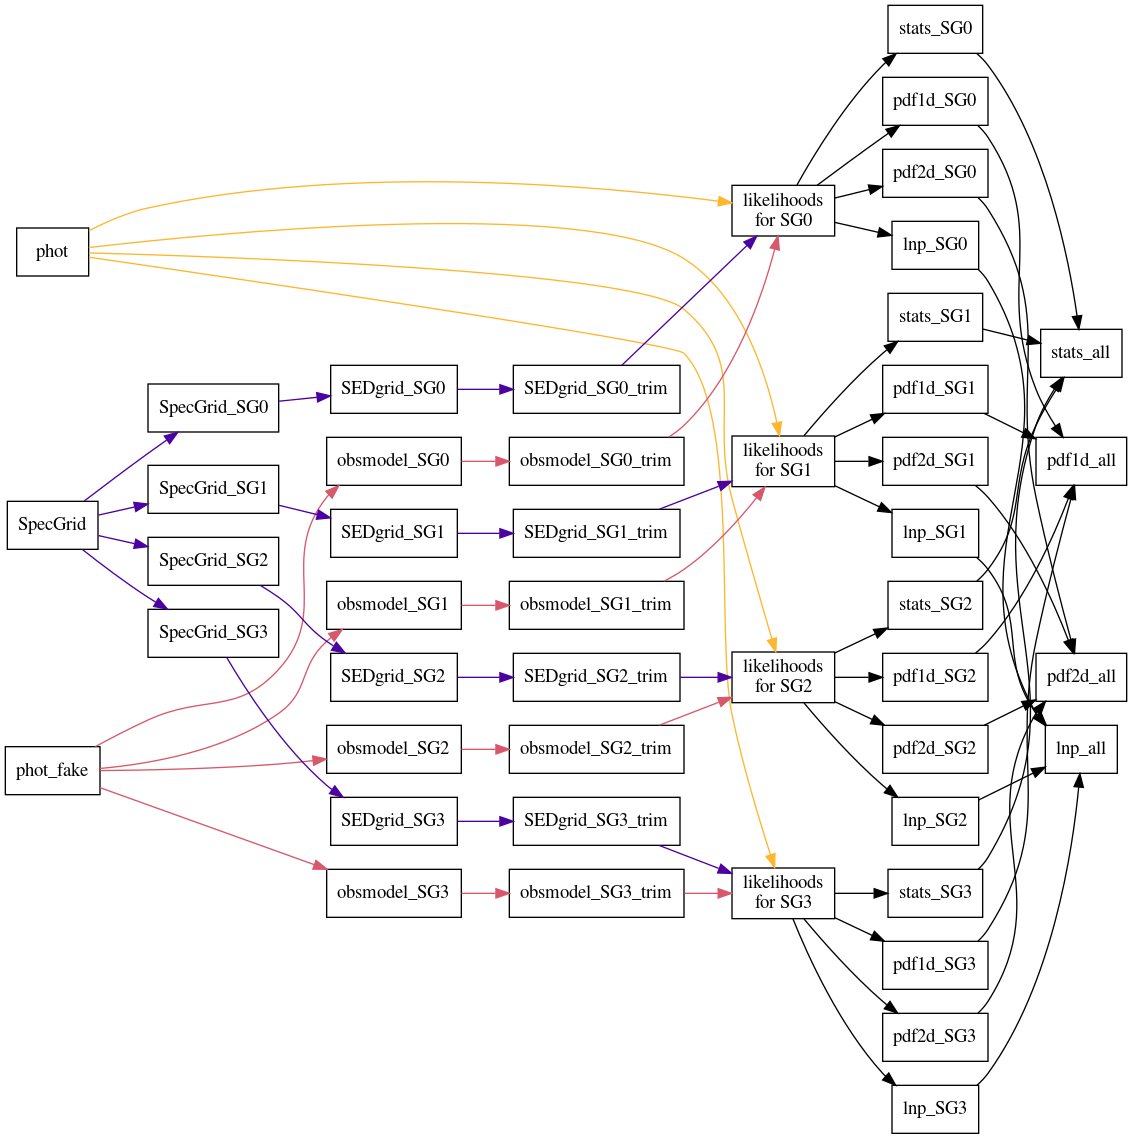
Generated with beast plot_graphic_file_flow --plot_type=subgrid --savefig=png.
Source Density
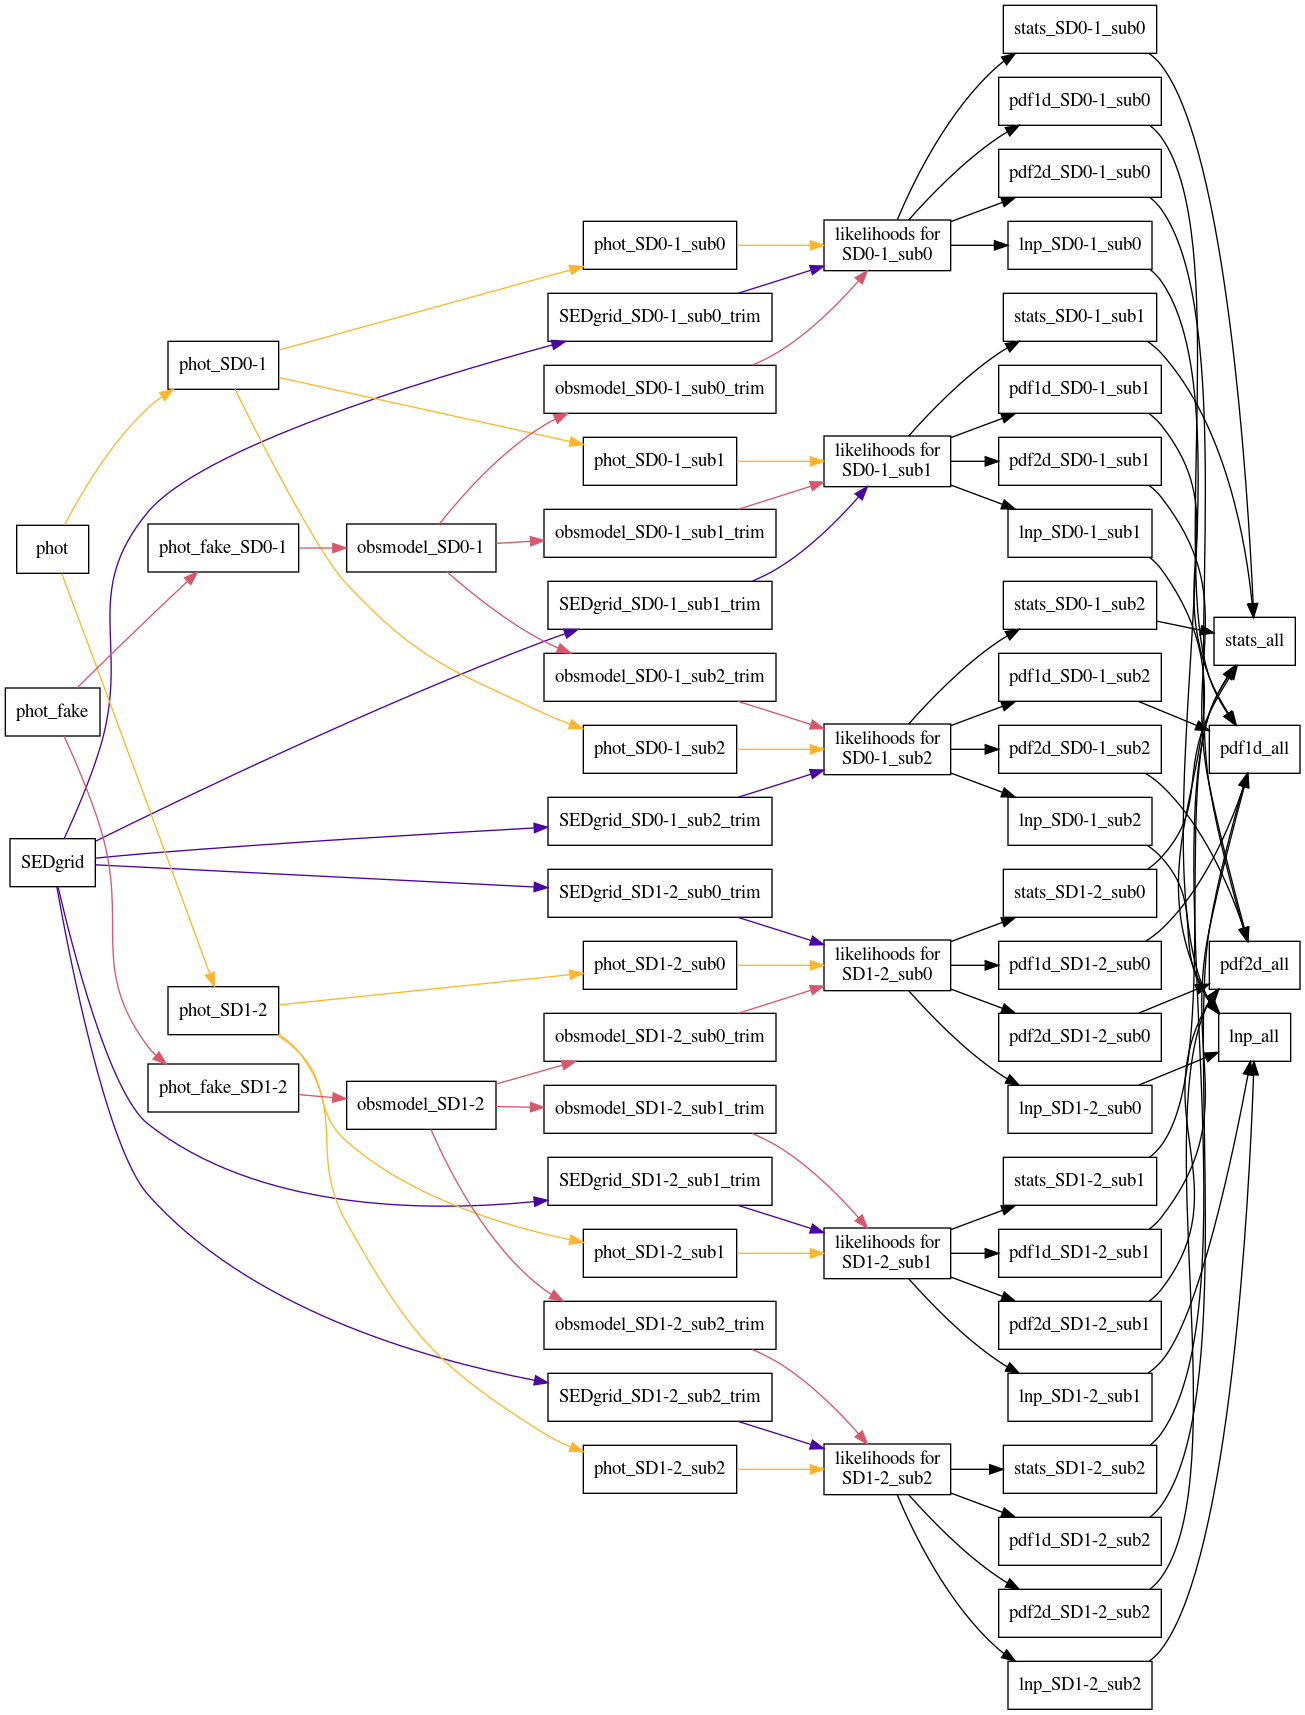
Generated with beast plot_graphic_file_flow --plot_type=sd --savefig=png.